Tutorial
This
simulated tutorial is similar with respect to techniques covered to the full
Weibull analysis tutorial by Fulton Findings (TM). The complete tutorial
includes:
![]() …Review of classic benchmark case studies using SuperSMITH(TM)
Weibull software.
…Review of classic benchmark case studies using SuperSMITH(TM)
Weibull software.
![]() …Detailed instructions for setup and data entry.
…Detailed instructions for setup and data entry.
![]() …Explanation and interpretation of results.
…Explanation and interpretation of results.
The tutorial example below comes
from Gerald Lawless, Statistical Models and Methods for Lifetime Data,
Wiley, 1982. He is a pioneer in the use of likelihood analysis techniques. The
data is from an actual study on the effectiveness of a particular
leukemia treatment, drug 6-MP. It can be used as a benchmark for
checking the accuracy of Weibull analysis software.
![]()
Likelihood
Ratio Confidence Example
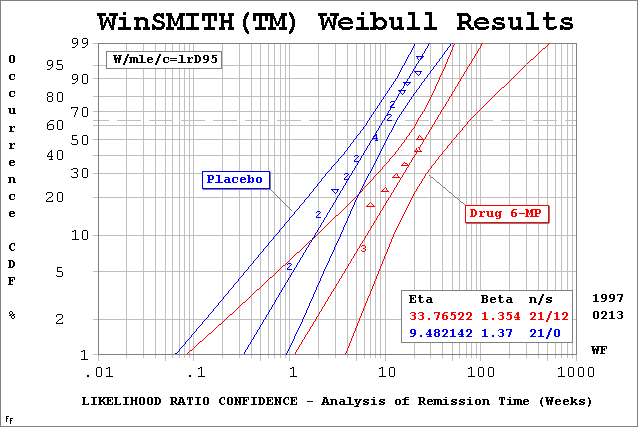
Symptom return times are shown in
the Weibull plot for drug 6-MP and a placebo. The drug 6-MP was administered to
a group of 21 people. Twelve of those did not have symptoms at the end of testing.
These twelve were considered suspensions (non-failures). The other nine people
given drug 6-MP had return of symptoms. All 21 people given a placebo indicated
return of symptoms. The data are given below.
Example 4.2.1, Page 175 in
Lawless [1982]:
Leukemia patients received either
drug 6-MP (left column) or a placebo (right column). The Xvalues
are times in weeks until cancer symptoms return. The original study validated
the benefits of drug 6-MP to significantly control these symptoms.
Data for likelihood ratio
confidence interval sample problem. Weeks until symptoms return. Note: negative
numbers indicate suspensions where symptoms did not return within test period.
Drug 6-MP, Placebo (comma used
for separation not decimal symbol)
6,1
6,1
6,2
-6,2
7,3
-9,4
10,4
-10,5
-11,5
13,8
16,8
-17,8
-19,8
-20,11
22,11
23,12
-25,12
-32,15
-32,17
-34,22
-35,23
To analyze in SuperSMITH:
1) Copy the data into the
clipboard.
2) Start SuperSMITH
Weibull (SSW).
3) Clear the program with the New
button (blank page icon) on the main screen and make sure that you are
analyzing with Weibull equations (computer icon).
4) Click the Method button
(showing regression ./. and mle
^ symbols), make sure Point-By-Point/Standard button is selected and then click
the Method mle button (^). At the Main Screen, the
only buttons depressed should be the Method button and possibly the Plot/Report
button.
5) Paste the data into the
program spreadsheet.
The benchmark reference gives
beta=1.35 and eta=33.77 for the data in the left column (drug 6-MP), and
beta=1.37 and eta=9.482 for the data in the right column (placebo). Using SuperSMITH you should get the same values.
6) Click on the Confidence button
(fit line between 2 confidence lines), select the Likelihood Ratio confidence
button (lr) and choose No to the Save Contour
question.
7) Select the Double Confidence
button and enter 95 for % confidence level. The program will take a few moments
while it performs lr calculations and then you should
see the plot with confidence lines unless Report is already selected.
8) Click on the Plot/Report
button (notebook or colored fit lines), choose Bvalue-Select,
1 value, 50 (for 50th percentile) and then select Report (ccc+Bvalue)
to change the results from plot to table output.
9) Click on the small table to
enlarge.
Set 1, drug 6-MP, should read Betal=.72 and Betau=2.2
(benchmark is .72 and 2.21) and B50 from 16.2 to 51.4 (benchmark is
16.2<B50<51.6). Set 2, placebo, should read Betal=.95
and Betau=1.88 (same as benchmark) and B50 from 4.755
to 10.3 (benchmark is 4.75<B50<10.3). SuperSMITH
is slightly more accurate than the benchmark here. You can also verify
probability confidence range at Xvalue=10 matches
closely the benchmark values of 63.7%-93.1% (Set 1) and 19.7%-51.3% (Set 2) by
using the Predict button (4 arrows) from the main screen.